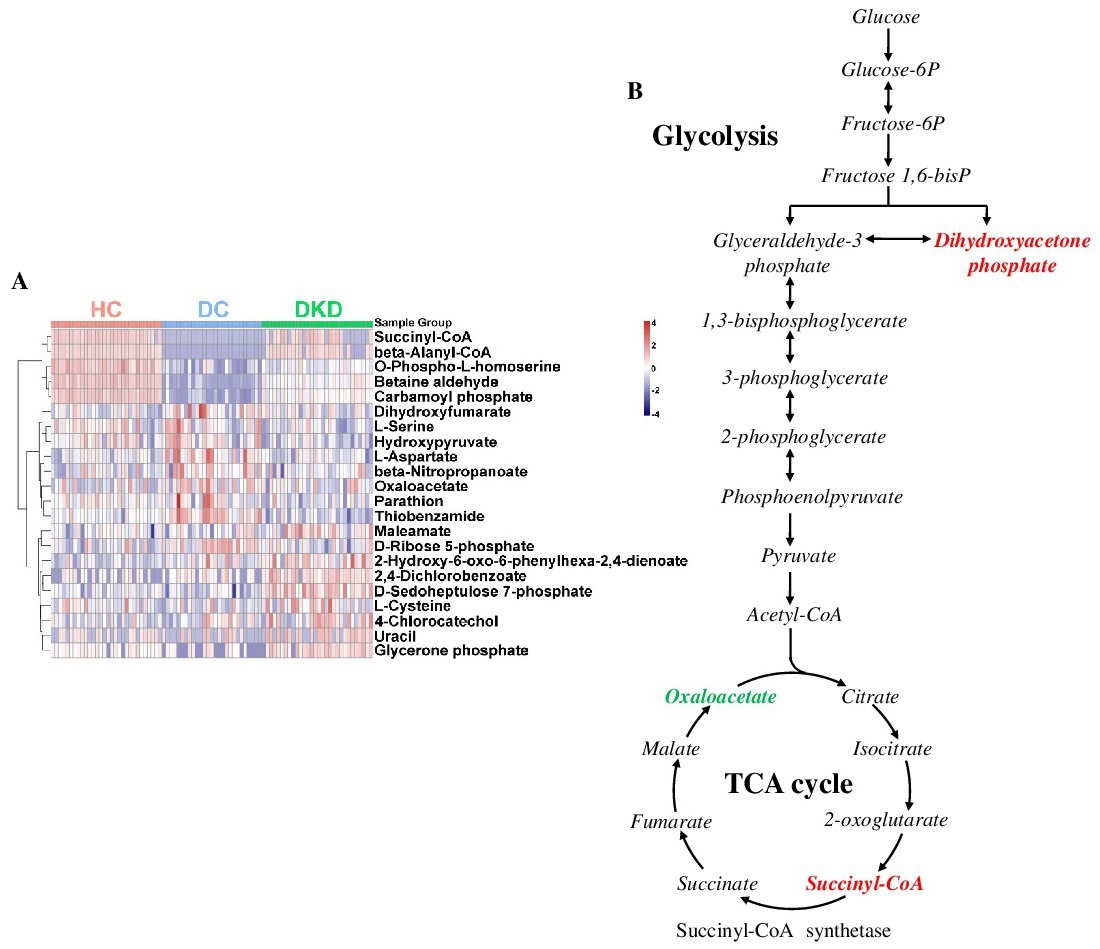
Fig. 5. Glycolysis and tricarboxylic acid (TCA) cycle was perturbed in serum of DKDs. (A) Heatmap (red=higher, green=lower) of 22 significantly different metabolites in HCs (n=30), DCs (n=27) and DKDs (n=30). (B) Schematic of glycolysis and TCA cycle involving 3 metabolites. Red denote increased levels and green denote decreased levels. HC, healthy control; DC, diabetic control; DKD, diabetic kidney disease; TCA cycle, tricarboxylic acid cycle.